Block out the noise. Last week’s action was loud and clear: the tape is turning. Fed chatter, tariff talk, AI hype—none of it matters as much as price, breadth, and structure. A rare Zweig Breadth Thrust triggered, one of the strongest bullish signals out there, but we don’t trade headlines or history—we trade what’s in front of us. While this is still a countertrend rally inside a structural downtrend, we’ll be monitoring the tape and our indicators closely for any signs of weakness. For now, momentum points higher. Listen to the market, not the media — and pay attention to the indicators.
- S&P 500 (SPX): Bullish price flip confirmed; targets 5,646, 5,746 (200DMA), 5,863.
- Dow Jones (INDU): Bullish price flip inside downtrend; resistance at 41,964 then 42,010.
- NASDAQ Composite (CCMP): Bulls confirmed; targets 17,909 then 18,338 (200DMA).
- US 10-Year Yield (USGG10YR): Countertrend rally vulnerable; retest of 4.02% to complete TD 13.
- DAX Future (DAX): Perfected TD 9 Sell but trend flipped higher; targets 22,602 then 23,204.
- EURO STOXX 50 (SX5E): Bullish trend shift confirmed; targets 5,297 then 5,496.
- US Dollar Index (DXY): Confirmed downtrend; downside targets 98.53 then 97.13.
- Gold (XAUUSD): Vulnerable after TD 13 weekly sell; close below 3,294 risks deeper unwind
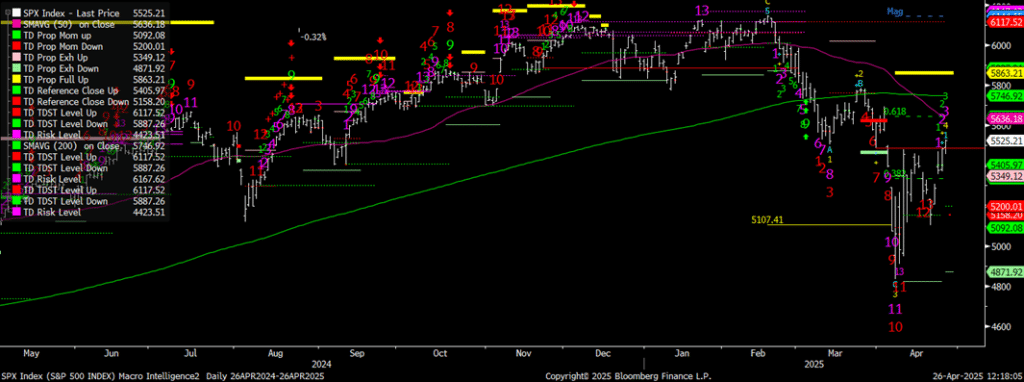
S&P 500 (SPX INDEX)
Last Wednesday, we laid out the setup: a bullish price flip in the S&P 500 if 5,275.70 could be cleared. The market delivered near textbook DeMark action—only Friday’s lower open kept it from being perfect. We closed up 1.67% Wednesday, ripped 2.03% higher Thursday breaking above the TD Reference Close, and added another 0.74% Friday. Bulls are firmly in control.The April 9th low around 4800 is now the key DeMark pivot, backed by a TD Sequential 13 Buy, TD Combo 13 Buy, and a perfected Weekly TD 9 Buy—all clustering at the 50% retracement of the post-COVID bull market, the same zone that reversed major bear cycles in 1987, 2009, and 2022…Upside targets line up at 5,646, then a retest of the 200-day moving average at 5,746, and finally 5,863. The structure has shifted. Stay tactical, but respect the turn.
S&P 500

Dow Jones-INDU
The Dow triggered a bullish price flip, putting bulls in control short term. This is a countertrend rally inside a broader structural downtrend, so treat strength tactically. Next resistance levels line up at 41,964 and then 42,010. All things being equal, the larger trend remains lower—this is just a rally within it.I
INDU
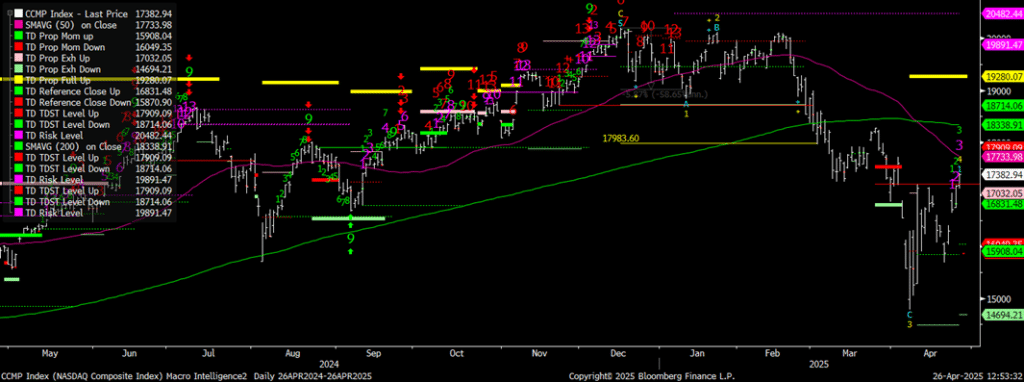
Nasdaq Composite-CCMP
On April 14th, we highlighted the setup for a powerful countertrend rally in the NASDAQ Composite, noting that structure was weak but a TD 9 Buy was about to print on the weekly chart. The initial pullback proved to be a buying opportunity. Last week, a bullish price flip and a close above the TD Reference Close confirmed the shift—putting bulls firmly in control in the short term. Next upside targets are 17,909, followed by a retest of the 200-day moving average at 18,338. Structure has improved, but keep perspective—this rally is emerging from deep oversold conditions, not the start of a fresh secular uptrend.
Nasdaq Composite-CCMP
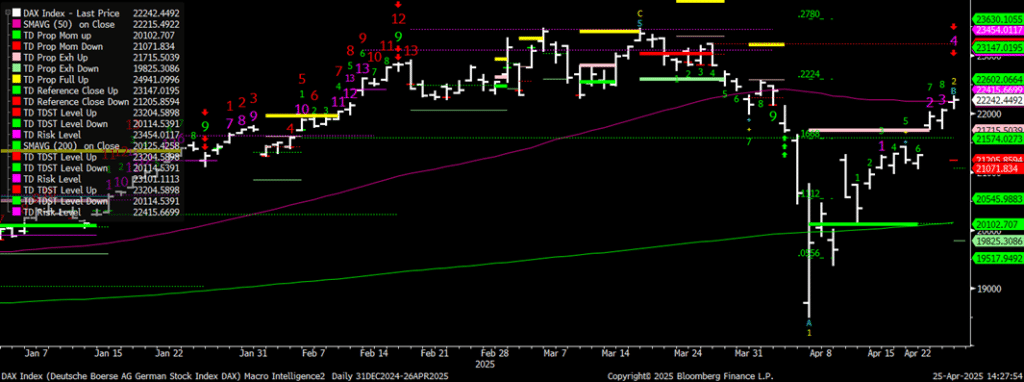
DAX FUTURE (DAX INDEX)
A perfected TD 9 Sell Setup printed Friday on the daily —normally a setup for a 1-4 session pause. But this isn’t just a tactical trade. Structurally, the DAX has confirmed a trend shift to the upside. The TD signal marks exhaustion within a newly emerging bullish phase—not the end of it. Next upside targets: 22,602 and then 23,204.
EURO STOXX 50 (SX5E INDEX)
Last week’s rally pushed SX5E decisively back above the 200-day moving average—a major technical level that now flips to support. With today’s perfected TD 9 Sell Setup on the daily, we might see short-term softness. But make no mistake—the trend has turned. The TD setup confirms it. Upside targets sit at 5,297, then 5,496.
SX5E

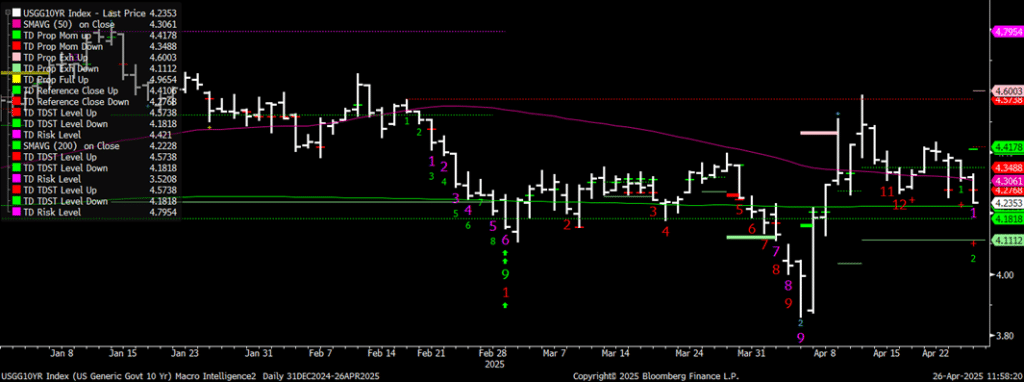
US 10-YR YIELD (USGG10YR)
The 10-year is sitting at a TD Sequential 12+ count on the daily chart. A bearish price flip and close below the TD Reference Close would put the bears firmly back in control. The countertrend rally over the past few weeks has failed to confirm any real trend reversal—this still looks like a corrective bounce within a broader downtrend. Watch for a retest of 4.02% to complete the TD 13 and set the stage for the next move lower.
USGG10yr
US DOLLAR INDEX (DXY)
DXY is in a confirmed downtrend, with the TD Sequential now at 11 of 13 on the daily chart. Momentum remains firmly bearish. Downside targets are 98.53 and then 97.13. No signs yet of exhaustion—trend pressure still points lower.
DXY

GOLD (XAUUSD)
Gold posted a perfected TD 13 Sell Setup on the weekly chart last week. Since then, the market’s bearish price flip has run into profit-taking, leaving gold looking vulnerable here. It got extended into record territory—and now the unwind is starting. A close below 3,294 followed by a lower open/lower low/down close would officially take the bulls out of the driver’s seat…Fundamentally, headlines around easing trade tensions between the U.S. and China have undercut haven demand. Despite still being up ~25% YTD, the rally is showing cracks. Gold for immediate delivery slipped back to $3,271 after tagging highs north of $3,500 earlier in the week. Watch for further pressure if sentiment continues to shift and technical triggers break.


