Yes, we’re overbought. The S&P has been steady-state overbought since mid-May, grinding higher with barely a pause. And remember: markets can stay overbought longer than you can stay short — ask anyone who’s tried. We laid it out last week: the structure was there — triple 13s on SPX, CCMP, and INDU, price flips lining up, SMH wobbling, TD Reference Closes cracking. It was as textbook as it gets. But we also said clearly: don’t take the bait without confirmation. No flip, no break, no trade. The setup was there, but it wasn’t active. And now we’re watching shorts get bled out one basis point at a time. SPX blew back through 6280.46 like it never mattered, erasing the flip and grinding to new highs — again. Same thing in CCMP and INDU. Structure hasn’t changed, but price action has completely neutralized the trade — for now. This is how markets punish early shorts: no fireworks, just slow-motion suffocation. Managers who came in light are now chasing strength into overhead resistance, while DeMark purists sit on their hands waiting for a confirmation that refuses to show. Meanwhile, cross-border flows are picking up, credit’s calm, inflation’s soft, and earnings aren’t bad enough to knock the wheels off. The result? A slow, deliberate melt-up. Every tick higher is just another body bag for the bears. The exhaustion signals are valid — that hasn’t changed. But until we get a price flip and a break of the TD Ref Close Down, this isn’t a short — it’s a trap. Anyone pressing here is just swimming upstream with ankle weights. And if you’re holding out for relief this week, good luck. Positioning is still underweight, flows are sticky, and the tape is levitating on disbelief and FOMO. You wanted a top? You got a tease. You wanted a break? You got a bounce. The setup’s still alive — but it’s not doing you any favors. And shorts? They’re getting steamrolled.
Summary:
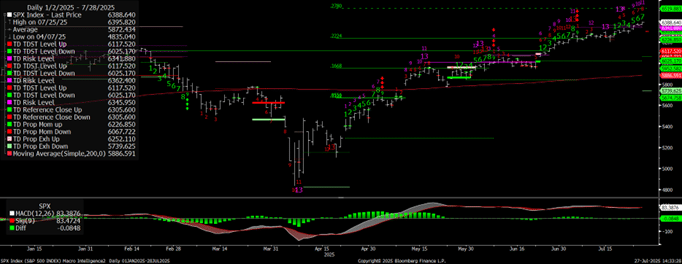
- SPX Index: Bulls still in control with TD Seq 8/13 and Setup 7/9; target 6519, support 6305.
- INDU Index: Combo 8/13, Seq 6/13 active; watch 45010 breakout, support 44323.
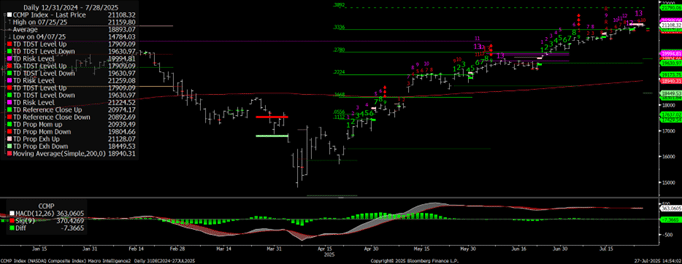
- CCMP Index: Combo 13 + Seq 10/13 signals exhaustion; target 21790, support 20892.
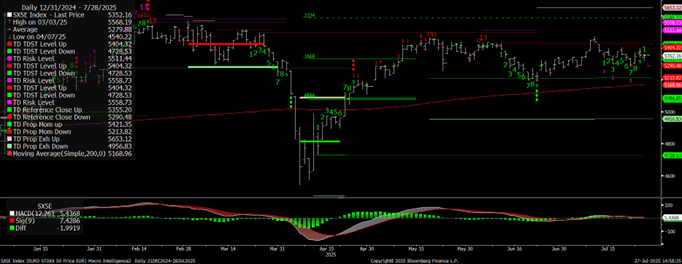
- SX5E Index: TD 9 buy and bullish flip; bounce risk with support at 5290.
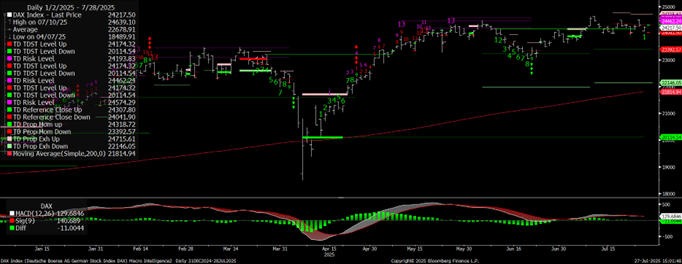
- DAX Index: Sideways chop; breakout above 24307 targets 24575–25706.
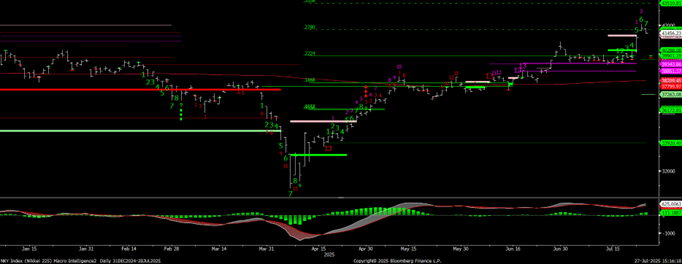
- NKY Index: Clean breakout from TD 9-13-7; target 41616 then 43510, support 39901.
- USGG10YR Index: Early bull setup (Seq 3/13, Setup 6/9); rangebound between 4.34–4.57%.
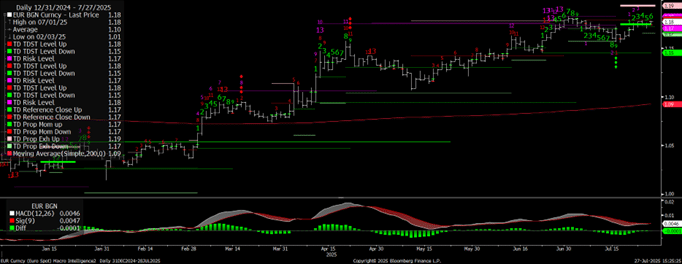
- EUR/USD: Pushing into 1.19 resistance; structure bullish above 1.17.
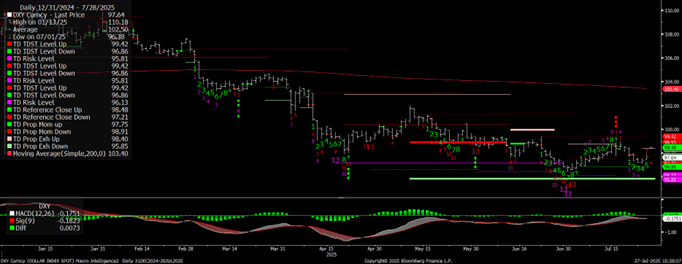
- DXY Index: Choppy with no trend; resistance 98.91–99.42, support 97.21.
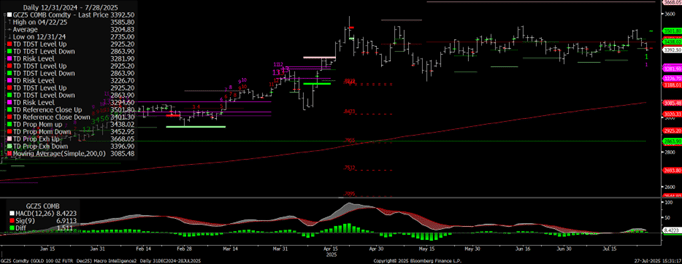
- GCZ5 Gold: Trapped in tight range; needs break above 3438 to clear.
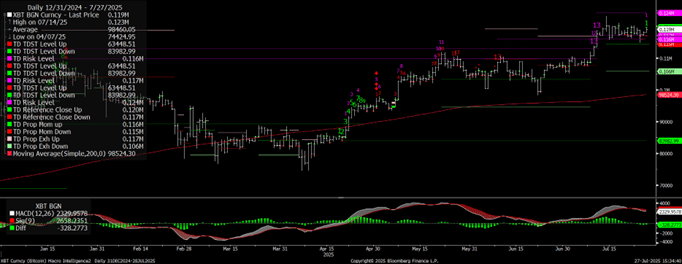
- XBT Index: Coiling post-TD13; breakout above 0.120M or breakdown below 0.117M.
S&P 500 continues to defy gravity, grinding higher despite a pile of broken DeMark 13s—both Combo and Sequential—littering the chart. We’re currently on an active TD Sequential 8 of 13 and a TD Setup 7 of 9, suggesting the exhaustion count isn’t finished. Bulls still control the tape, with MACD hovering just under the signal line but offering no real bearish confirmation yet. Key downside levels to watch include the TD Ref Close Down at 6305.60, Propulsion Momentum Up at 6226.85, and TDST Level Down at 6025.17. Until we get a bearish price flip and follow-through, these DeMark signals remain just that—signals. The upside target at 6519.88 remains valid, and until proven otherwise, every short is just fuel for the next squeeze.
SPX Index
Dow Industrials (INDU) are marching higher with the bulls firmly in control. An active TD Combo 8 of 13, TD Sequential 6 of 13, and TD Setup 5 of 9 all point to a market still pushing through its exhaustion cycle. Price action is knocking on the door of key resistance, and a close above the TD Reference Close Up at 45010.29 would clear the way for upside targets at 45524.85 and 46244. Initial support comes in at the TD Reference Close Down at 44323.07—as long as price holds above that level, the bullish structure stays intact. MACD remains soft, but not yet signaling any meaningful reversal.
INDU Index

NASDAQ Composite (CCMP) just printed a TD Combo 13 sell, stacking on top of an active TD Sequential 10 of 13—clear signs we’re deep in exhaustion territory. Price tagged the TD Prop Exhaustion Up at 21128 and is inching toward the TD Risk Level at 21259, with the final stretch pointing to 21790. Bulls still have momentum, but it’s getting stretched. Any long here needs tight stops—starting with the TD Reference Close Down at 20892.69. A close below that flips the tone fast. MACD is fading, still negative, and confirming the stall. This is a spot to tighten up, not press bets.
CCMP Index
SX5E just printed a TD 9 Buy Setup alongside a bullish price flip, opening the door for a countertrend rally before the next leg lower. This bounce could have some near-term legs, but the broader structure remains vulnerable. Keep eyes on TD Reference Close Down at 5290.48—that’s your initial support. If price holds above there, bulls may get a temporary reprieve. But any failure to sustain the bounce keeps the broader trend under pressure. MACD remains negative and drifting, showing there’s no real momentum behind the move—yet.
SX5E Index
DAX is stuck in purgatory—churning sideways in a tightening range with no real momentum either way. Multiple TD Combo 13s marked the recent highs, but there’s been no follow-through since. Price is consolidating between the TD Reference Close Up at 24307.80 and TD Reference Close Down at 24041.90—those are your key pivot levels. Until one breaks, it’s a trader’s market. Upside targets come in at 24575, 24715, and a stretch goal of 25706 if the breakout sticks. MACD is soft and fading, but no decisive cross yet. Bottom line: stuck in the middle and waiting on a catalyst.
DAX Index
Nikkei (NKY) is on a tear, breaking out of consolidation and riding a clean TD 9-13-7 sequence higher. Momentum is building—MACD accelerating with a wide positive spread—and price action is confirming. Immediate upside target is 41616, with a stretch goal up at 43510. As long as price holds above the TD Reference Close Down at 39901.19, the breakout remains valid. This is a classic trend extension setup, with structure, momentum, and levels all lining up for the bulls.
NKY Index
US 10-Year Yield (USGG10YR) remains in chop mode, stuck in a tight range with no clear conviction. We’re on a TD Sequential 3 of 13, early in the signal count and still consolidating right on the 200-day moving average. The yield failed at the prior TD Combo 13 top near 4.57%, which now stands as the key upside target and resistance. Support comes in at the TD Reference Close Down at 4.34%—a break below would tilt the structure more bearish. Until then, it’s range-bound noise. MACD is flatlining, confirming the stall. No edge here—just levels and patience.
USGG10YR Index

EUR/USD continues to press against the ceiling, trading just below the prior TD Prop Exhaustion Up at 1.19, with a steady grind higher. Bulls are back in control, riding a TD Setup 6 of 9 off the recent bullish price flip. Momentum is rebuilding—MACD is curling up just above the zero line, and the sequential count is rising. Immediate resistance sits at 1.19, and a close above opens the door for fresh highs. Support comes in at 1.17, where multiple TD Reference and Prop levels converge, giving bulls a well-defined level to defend. As long as price stays above 1.17, the structure favors continuation higher.
EURUSD
DXY (US Dollar Index) remains stuck below major resistance, with momentum fading and no clear trend in place. We’re mid-cycle on a TD Sequential 5 of 13 and TD Setup 3 of 9, while price churns below the TD Risk Level at 98.91 and TDST Level Up at 99.42. MACD is negative and drifting sideways, confirming the indecision. Upside resistance comes in at 98.48 and 99.42; those levels must break to reassert any bullish structure. On the downside, TD Reference Close Down at 97.21 is your first support—lose that, and the prior lows near 95.81–96.36 come back into play. For now, the DXY is still a chop zone—no edge, just range.
DXY Index
Gold (GCZ5) remains trapped in a painful consolidation, stuck in a tight chop where every breakout attempt gets faded and every breakdown is met with a bid. It’s been a whipsaw-heavy mess since topping out on the TD Combo 13 back in April. We’re currently printing a fresh TD Setup 1 of 9, hinting that another directional push may be building, but no confirmation yet. Price is pivoting around key levels—TD Reference Close Up at 3501.80 caps the upside, while TD Prop Momentum Down at 3452.95 is acting as interim support. Momentum is trying to turn higher—MACD is positive and the diff line is still rising—but price needs to break and hold above 3438.02 to open a cleaner path higher. Until then, it’s a range trader’s game: fade the edges, don’t chase.
GCA Cmdty
Bitcoin (XBT) is coiling just under resistance, consolidating off the recent TD Combo 13, which has now fully expired. The setup is primed for a breakout—or breakdown—depending on confirmation. A close above the TD Reference Close Up at 0.120M, followed by a higher open, higher high, and up close, would confirm upside continuation. Conversely, a breakdown would require a close below 0.117M, followed by a lower open and down close to confirm downside pressure. For now, it’s a textbook balance—volatility has compressed, MACD is neutralizing, and traders are waiting for a trigger. This one’s on deck.
XBT Index


Im seeing other market commentators making much the same point. Seems to be a general feeling of nervousness.