Comment
Last week, we introduced our new TD Chart Point, using the work of a long-time friend of the business, Kevin O’Dowd, who we believe is one of the best DeMark chartists in the market. Today, we want to update our thoughts and, in particular, draw your attention to the Nasdaq and the EURUSD because next week’s set-up could be decisive. Once again, there is an appendix at the end of the piece for any TD novices. Also, we are in the process of refining this product, so if anyone has any suggestions on anything we could improve or offer, please reach out.
S&P 500 SPY 609.875 – Bulls in Control
We wrote that while there are clear signs of exhaustion, “there is nothing harder than trying to pick a top” in stocks. That is especially true in the S&P, where there are so many places to hide, and yet again, that has proved to be the case. We are currently on day seven of nine (TD 7 of 9 sell) with bulls in control. Next up, watch 614.57, then 623.75. One note of caution. While momentum is strong, we are approaching key exhaustion levels.
Resistance Above:
• 609.07 – Critical ATH resistance already breached.
• 614.57 – Marked by TD Sequential and Combo indicators as potential sell zones.
• 623.75 – Potential exhaustion level per TD Prop, aligning with psychological resistance.
Support Beneath:
• 596 – TD Prop level.
• 591.64 – TD reference close.
• 587.45 – A breach would disrupt the bullish narrative.
• 581.63 – Confirmation of a reversal if breached.

Nasdaq QQQ 532.30 – Bulls in Control for Now
The QQQs are also on a TD 7 of 9, which has the bulls in control, and yesterday’s close above the key resistance at TD prop 531.22 was impressive. However, we’re on track for a TD 9-13-9 sell signal next week, which could mark a top. At this stage, there is no need to jump the gun, so stay “long until proven otherwise”.
Resistance Above:
• 538.17 – Current All-Time High.
• 541.20 – TD Prop exhaustion zone, signalling strong momentum but high reversal likelihood.
• 547.77 – TD Sell risk level.
Support Beneath:
• 519.13 – TDST Support Level.
• 499.12 – TD Prop level, losing this confirms a near-term trend reversal.
• 497.56 – Critical support.

Gold GLD – Bulls Firmly in Control
Last week, we noted the beginning of a big move higher with a TD +13 buy. Currently at TD 8 of 13 within a clear upward trend that looks to be more than just a temporary spike.
Resistance Above:
• 254.86 (breached) and 257.53 – Next key resistance levels.
• 260.00 – TD Prop, indicating a significant bullish potential.
Support Beneath:
• 249.00 – Initial support level.
• 243.89 – TD Prop exhaustion down.

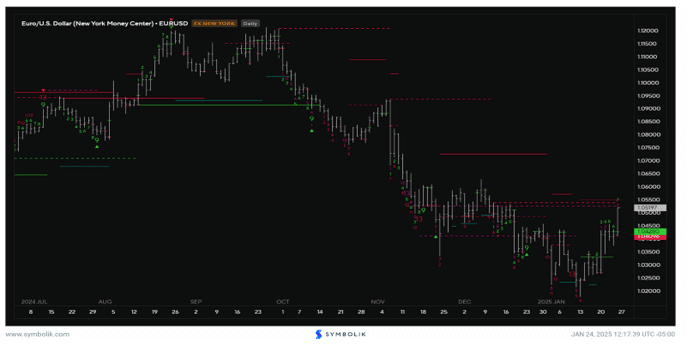
EUR/USD 1.05146 – Bulls in Control for Now
Last Friday, in addition to gold, we flagged a range of commodities and related equities that all looked ready to bounce. However, the fundamental problem is that to be structurally bullish on the commodity space has historically required a bear market in the dollar. Right on cue, EURUSD had its best week in a year. Yet, as with the Nasdaq, a TD 7 of 9 suggests that while the bulls are in control for now, next week will decide if this bounce is simply a correction within the trend or the Euro’s low is in place.
Resistance Above:
• 1.0530 – Initial resistance.
• 1.0550 – TD Prop, a break above indicates strong upward momentum.
Support Beneath:
• 1.0428 and 1.0400 – Key support levels to monitor for potential trend reversals.
10-Year Treasury Yields TNX 4.63 – Bulls in Control
Despite last week’s pullback, the TD count and today’s bullish price flip suggests that yields are set to retest recent highs and potentially beyond.
Resistance Above:
• 4.69, 4.72/4.78, 4.80 – Immediate to medium-term targets.
• 4.91 – Uppermost expected resistance in the current trend.
Support Beneath:
• 4.57 and 4.52 – Initial and secondary support levels, crucial for maintaining the bullish stance.

Appendix
DeMark Indicators are a suite of proprietary market-timing metrics created by Tom DeMark used to identify trend exhaustion points, momentum shifts, and significant price levels. Below is a concise description of the key DeMark indicators.
- TD Setup
• Market moves are segmented into nine consecutive bars:
o +9 (buy) Setup: Nine bars where the close is above the close four bars earlier.
o -9 (sell) Setup: Nine bars where the close is below the close four bars earlier.
• While multiple TD Setups can occur within a trend, the completion of a Setup signals a potential near-term trend reversal. - TD Sequential and TD Combo
• Once a TD Setup is complete, signs of exhaustion are identified using:
o TD Sequential: Derived using specific calculations to signal a +13 (buy) or -13 (sell).
o TD Combo: Uses an alternative calculation to reach similar +13 or -13 exhaustion points.
• Both tools are ideal for timing exits, reducing risk, or initiating counter-trend trades by identifying trend tops and bottoms. - TD Propulsion
• Tracks momentum within move and identifies key exhaustion points:
o Propulsion Exhaustion: Levels where trends may lose momentum. - TD Trend Factors
• Highlights support and resistance levels based on prior price highs and lows.
• Uses Fibonacci-derived increments (5.56%) to define significant price levels. - Qualified and Confirmed (Q&C) Breakouts
• Ensures breakouts are valid by requiring a specific sequence of three consecutive price bars:
o Upside Breakout: A down close, followed by a gap higher open, and a bar with a higher high.
o Downside Breach: An up close, followed by a gap lower open, and a bar with a lower low.
• These indicators are valued for their precision in timing market moves and their ability to guide both trend-following and counter-trend strategies.
As we discussed, we will apply the TD Indicators as follows:
- Look for the TD 13 Exhaustion Signal
o For example, when a red 13 appears on the chart, it signals that momentum is running out, which is why we flagged the growing risks to the S&P a few weeks ago (“MI2 Trader: Good is Bad,” Nov 15, 2024). - Wait for Confirmation
o Avoid premature moves. After the TD 13, wait for clear follow-through signals, such as:
A lower open, lower low, and down close, or
Testing of key TD Risk Levels.
o The goal is to avoid chasing the trade and instead patiently wait for the setup to mature. - Pull the Trigger When the Market Blinks
o Once confirmation is clear, act.
o Whether fading a rally or buying into a sell-off, capitalize on exhaustion by entering when others are overcommitted in the wrong direction.

