Comment
Last week, we noted: “The spotlight has shifted unmistakably to the US Dollar Index (DXY), which flashed a glaring TD 13 sell signal, possibly marking a significant turning point. The bearish indication could have profound impacts across various asset classes”. This week, continued dollar weakness is now creating cracks across the major US equity indices with bearish price flips on the S&P 500 and NASDAQ Composite (CCMP). While the Dow Jones Industrial Average (DJIA)—our “canary in the coal mine”—has already confirmed downside continuation. This is a critical signal that bears watching.
Stay nimble, watch the tape closely, and remember: “When liquidity pulls out, the tide lowers everything.”
Market Summary – This Week
- S&P 500 (SPX): Bearish price flip and close below support signals downside risk.
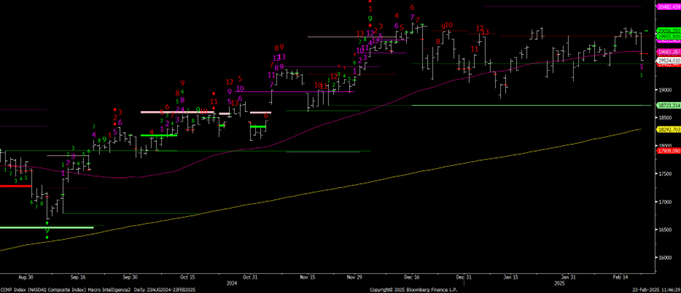
- NASDAQ Composite (CCMP): Bears gained control on Friday’s close. Watch for further downside.
- Dow Jones Industrial Average (INDU): Friday’s tape suggests a top, signalling downside continuation.
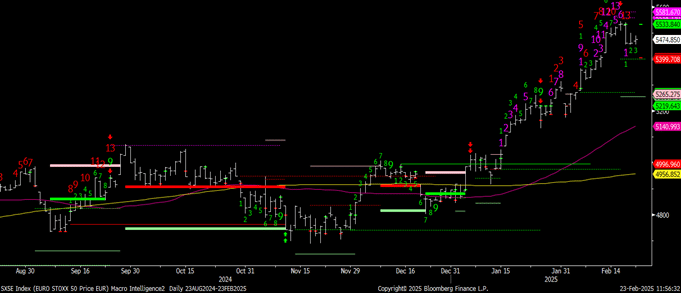
- EURO STOXX 50 (SX5E): Multiple TD 13 sells and bearish price flips point to a potential top.
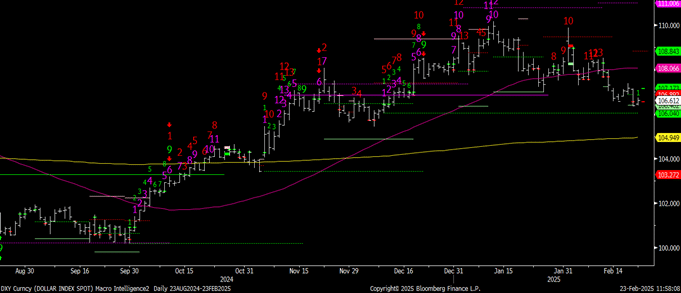
- US Dollar Index (DXY): Multiple TD 13 sells indicate continued bearish dominance.
- EUR/USD: TD 6 of 13 confirms bulls remain in control.
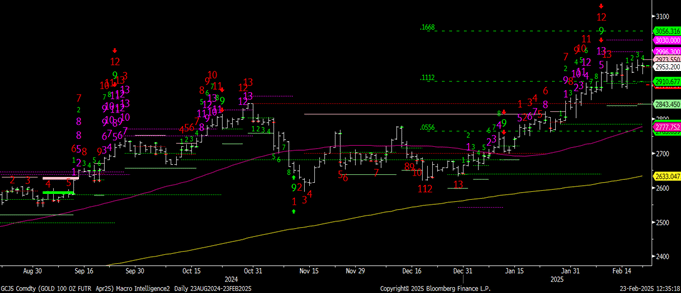
- Gold: TD 13-4 sell but the uptrend remains intact with consolidation likely.
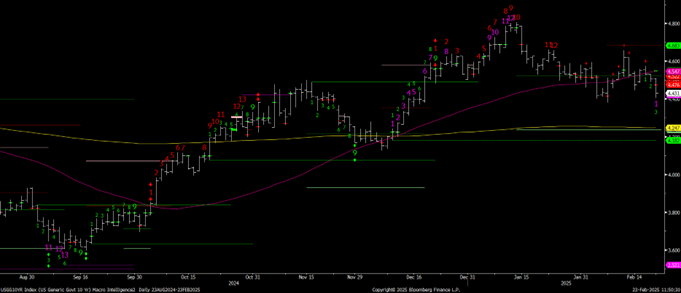
- 10-Year Treasury Yield (USGG10YR): TD +12 signals an uptrend, but a break below key support could flip momentum.
Charts
S&P 500 A bearish price flip and close below support. A lower open/lower low/ down close on Monday puts bears in control. Watch 6009 for initial support then 5887 and 5872. Look for initial resistance at 6074, 6144 and 6167.

NASDAQ Composite (CCMP): Friday’s close gives bears the price flip they needed. A lower open, lower low, and down close on Monday puts bears in control. Look for initial support at 19643. Then 18990 and 18723. Look for initial resistance at 19955/20056 then 20842.
Dow Jones Industrial-INDU: Is the Dow the “canary in the coal mine” that has market prognosticators calling for a top? Friday’s tape suggests downside continuation and a potential top in place. Watch 43081 and 42518 for initial support then 42067. Resistance? 44627, 45059 and 45575.

EURO STOXX 50 (SX5E): Multiple TD 13 sell signals and a bearish price flip, similar to the DAX, CAC, SXXP, and IBEX, point to a potential top and downside risk across European indices. Look for 5405 for support then 5271 and 5255. Resistance? 5533, 5558/81.
USGG10YR 10-Year Treasury Yield (USGG10YR): TD +12 keeps us in the uptrend, but Friday’s bearish price flip and close below support, followed by a lower open, lower low, and down close would put bears in control in the short term. Watch 4.421, 4.237, and then 4.182 as support levels. Resistance levels stand at 4.550 and 4.680.
US Dollar Index (DXY): Multiple TD 13 sell signals keep bears in control, pointing to a potential major top. Watch 106.575 for support then 106.040 and 103.197. Resistance? 107.173, 108.843 then 111.006
EUR/USD: TD 6 of 13 confirms uptrend. Bulls remain in control. Watch 1.052/54 for initial resistance then 1.07. Support? Look for initial support at 1.042 then 1.026 and 1.008.

Gold: While the TD 13-4 sell has bears calling for a top, multiple setups keep the uptrend intact and suggest consolidation before the next move higher. Traders can take profits, but we’d be buyers on a pullback. Initial support 2900. Then 2843 and 2784. Upside targets 2973, 2996 then 3030.