Three new highs on the board last week — SPX, INDU, and RUT — and the bears are still grumbling about divergences while the tape keeps grinding higher. Powell went full dove at Jackson Hole, effectively locking in a September cut, and the 10-year can’t lift off the floor with the roadmap still pointing to 4.15. Breadth is finally catching up, with a 91% up-volume day, NYSE A/D at fresh highs, and equal-weight indices breaking out after months of sideways churn. It’s not the cleanest breakout — tech is still choppy, the dollar’s consolidating, and Europe remains stuck under major resistance — but the weight of evidence keeps the path of most pain pointed higher. We nailed the July selloff in yields off the TD 13, and that call continues to underpin risk. Now you’ve got record shorts trapped in small caps, a Dow breakout confirmed on heavy volume, and gold quietly coiling for an eventual launch. Unless resistance zones reject hard — 6,519 on SPX, 46,244 on the Dow, 2,418 on the Russell — this is still a bull’s tape: methodical, grinding, and punishing anyone fighting the trend.
Summary
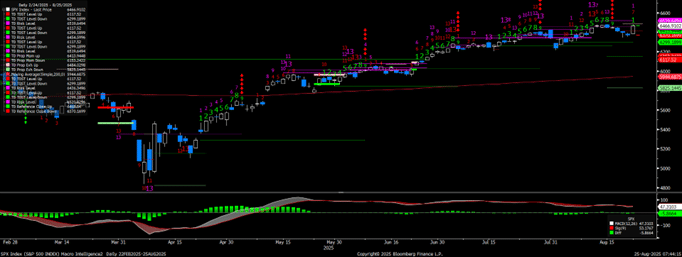
- SPX: Bulls in control, TD 7 of 13; resistance 6,468/6,519, support 6,371/6,299.
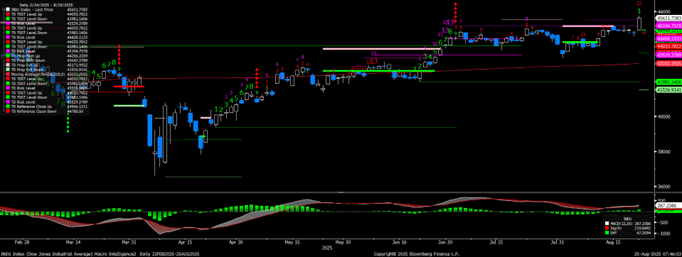
- Dow: Breakout confirmed above 45,195; next 46,244, support 43,975.
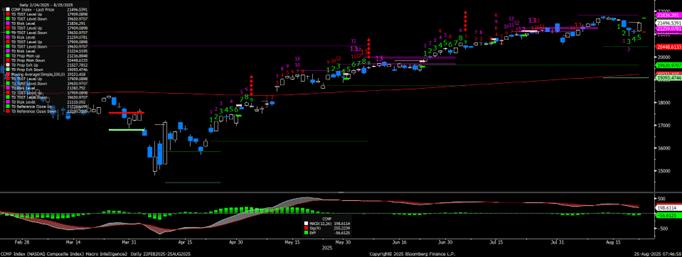
- Nasdaq: Bullish flip; targets 21,527 then 21,836.
- Russell: TD 13 buy; squeeze toward 2,418–2,470, must hold 2,269.
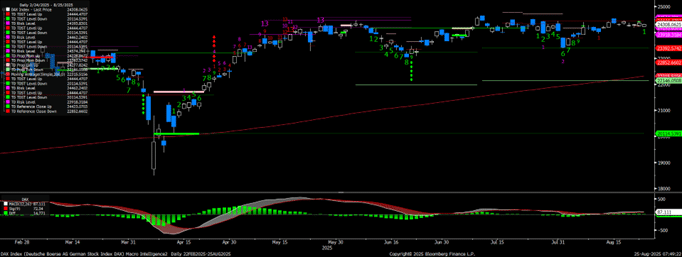
- DAX: Still capped below 24,648; rangebound, support 22,852.
- Euro Stoxx: Uptrend intact, TD 3 of 13; breakout needs 5,558–5,620, hold 5,337.
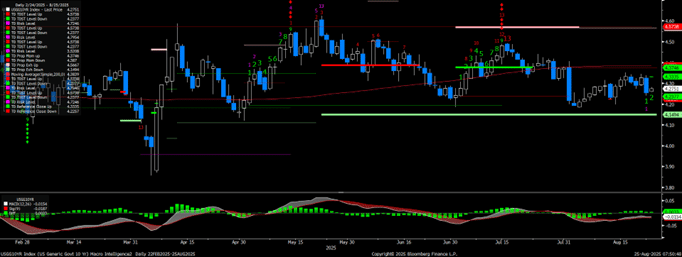
- 10Y: Yield heavy at 4.29; roadmap still 4.15.
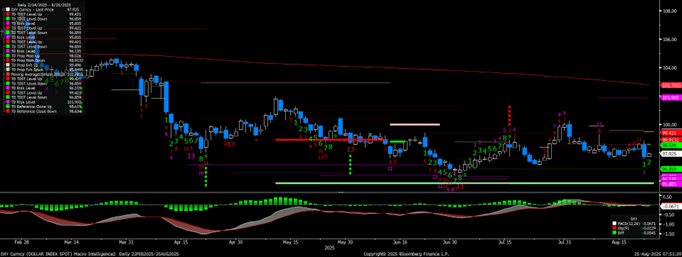
- DXY: At 97.9, TD 11 of 13; chop with downside to 95.8.
- EUR/USD: At 1.17, bulls control; upside 1.1790, floor 1.1528.
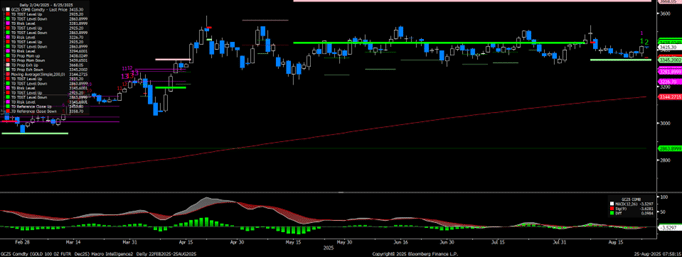
- Gold: At 3,417, still coiling; support 3,345, resistance 3,450/3,686.
The S&P 500 closed at 6,466 with the bulls pressing higher, now on TD 7 of 13 and pushing against initial resistance at 6,468, with the next upside marker at 6,519. A decisive break would open the door to the 6,648–6,661 zone, but for now, momentum is still building, not exhausting. Support sits at 6,371 and 6,299, with deeper protection at 6,117 and the 200-day down at 5,944. Breadth and internals continue to confirm strength, and while MACD momentum is narrowing, nothing here signals a reversal. It’s still a bull’s tape—any dips into support should be shallow, and unless 6,519 rejects price hard, the path of most pain remains higher.
SPX Index
The Dow finally delivered the breakout we were waiting on, clearing 45,195 with authority and doing it on the heaviest weekly volume since April’s low. Price is now sitting at TD Sequential 12 of 13, on the verge of printing a 13 off Setup 2, but unless we see a bearish price flip and confirmation below the TD Reference Close, the setup isn’t actionable. For now, the bulls are firmly in control. Breadth and internals have improved—NYSE advance/decline line confirmed fresh highs, the Equal-Weight S&P broke out after nine months, and a 91% up-volume day underpinned the move—classic coiled spring behavior that forces shorts to cover and rotation to kick in. The next target is 46,244 (Trend Factor), with the larger inverse H&S roadmap still pointing toward 53,400 over time. Key support sits at 43,975 (TD Ref Close Down); lose it, and the range reasserts with 43,240 back in play. Until then, this is a confirmed breakout, not a fakeout—the burden of proof has shifted back to the bears.
INDU Index
The Nasdaq Composite flipped bullish today, giving control back to the buyers after a stretch of hesitation. The first target is 21,527, with the TD Risk Level up at 21,836, marking the next meaningful objective. Friday’s action already hinted at strength, with breadth thrusts across the tape—84% of S&P stocks advancing, NYSE net new highs surging, and the Equal-Weight S&P finally breaking out of nine months of consolidation. Those confirmations matter, because they show participation is broadening beyond just the mega caps. While the Nasdaq has been a relative laggard compared to the Dow and Russell, today’s bullish price flip signals momentum is reasserting. As long as price holds above the TD Reference Close at 21,070, dips should be contained and the roadmap stays skewed toward higher levels, with 21,836 the next hurdle for the bulls.
CCMP Index
The Russell 2000 closed at 2,353 and printed a TD 13, with the bulls seizing control and eyeing higher levels. The immediate target sits at 2,418 (TD Propulsion Exhaustion Up), which lines up neatly with the unfulfilled objectives flagged in prior notes. Beyond that, the measured move from the completed inverse head-and-shoulders pattern points toward the old highs near 2,470. Support comes in at 2,269 (TD Reference Close Down) and then deeper at 2,194 (TD Risk), with the 200-day moving average down at 2,112 as the key line in the sand. Positioning remains a critical tailwind—hedge funds are still record short the Russell, and Friday’s bullish engulfing candle trapped them further, forcing a scramble that is adding fuel to the move. As long as 2,269 holds, the roadmap is higher, and the squeeze toward 2,418–2,470 remains the path of most pain.
RTY Index

The DAX is still stuck in consolidation and trading heavy beneath resistance. The tape continues to stall well below 24,648, the TD Trend Factor and major ceiling, with even the nearer TD Risk Level at 24,193 proving tough to sustain. Momentum remains suspect—MACD has yet to turn convincingly higher—leaving this bounce looking more like noise within a broader range than the start of a new leg up. Immediate support remains the TD Reference Close Down at 22,852, and a break there would quickly expose 23,392 and 23,146, with deeper downside risk toward 22,146. Until the bulls can punch through 24,648 with conviction, this is still a rangebound tape leaning defensive, with the burden of proof squarely on buyers.
DAX Index
The Euro Stoxx 50 is tracking higher in a confirmed uptrend, now on TD 3 of 13 with momentum building. The immediate upside levels to watch are 5,558 and then 5,620, which would mark a breakout and extend the advance. To keep this structure intact, the index needs to hold 5,337 (TD Reference Close Down) on any pullback. As long as that level provides support, the roadmap favors continuation higher, but without a decisive push through resistance, the move risks stalling into consolidation. For now, the bulls have the upper hand, but the burden is on them to confirm the breakout.
SX5E Index

The US 10-Year closed at 4.29 and still looks heavy, capped by resistance at 4.33–4.37 with key support down at 4.15, and unless yields can reclaim the 200-day with conviction, the bias stays lower. We nailed the July selloff off the TD 13 sell signal, and the structure hasn’t changed—momentum remains soft, Powell’s dovish turn has September cuts priced near 90%, and the 2-year note is already screaming the Fed is 50–75bps too tight. The setup remains a bearish consolidation with 4.15 the roadmap target, and until that level breaks, the message is clear—the path of least resistance for the 10-year is still down, a backdrop that keeps the bid alive in equities and gold.
USGG10YR INDEX
The DXY closed at 97.88 and sits on TD 11 of 13, which technically keeps it in an uptrend, but the reality is this has been more consolidation than directional strength. Friday’s bearish price flip underscores the lack of momentum, and the levels are clear: support comes in at 96.86, with a deeper line at 95.81 if pressure builds. Unless DXY can reclaim 98.91–99.42 with authority, the weight of evidence points to further drift lower. Bottom line: the dollar remains trapped in chop, leaning heavy, and the path of least resistance is toward that 95.8 zone.
DXY Curncy
EUR/USD closed at 1.17 and sits on TD 2 of 13, keeping the bulls in control after the TD 9 sell on 8/14 confirmed a reversal in trend to the upside. The broader structure is still defined by rangebound trade since June, but momentum has shifted—buyers stepped in after the short-term pullback, and price action has held firm above key support at 1.1528 (TDST Level Down). The ceiling remains 1.1790 (TDST Level Up), and until that level breaks with conviction, this is still a grind rather than a clean breakout. MACD remains flat near zero, consistent with consolidation, but the bias has turned higher, and unless 1.1528 fails, the path of least resistance is toward testing 1.1790.
EURUSD Curncy

Gold closed at 3,417 and continues to hold its long consolidation, carving out a broad base that remains constructive. Buyers defended key levels last week, keeping the structure intact, and while price is still capped below 3,450, the broader setup argues dips are buyable, not breaks. Momentum is flat and drifting—classic basing action—but that’s exactly the point: the longer the coil, the more powerful the eventual release. Support sits at 3,345 and deeper at 3,226, with resistance at 3,450 and then 3,686. Until proven otherwise, gold remains a patience trade—still bullish, still coiling, and when it goes, it should go hard.
GCA Comdty